
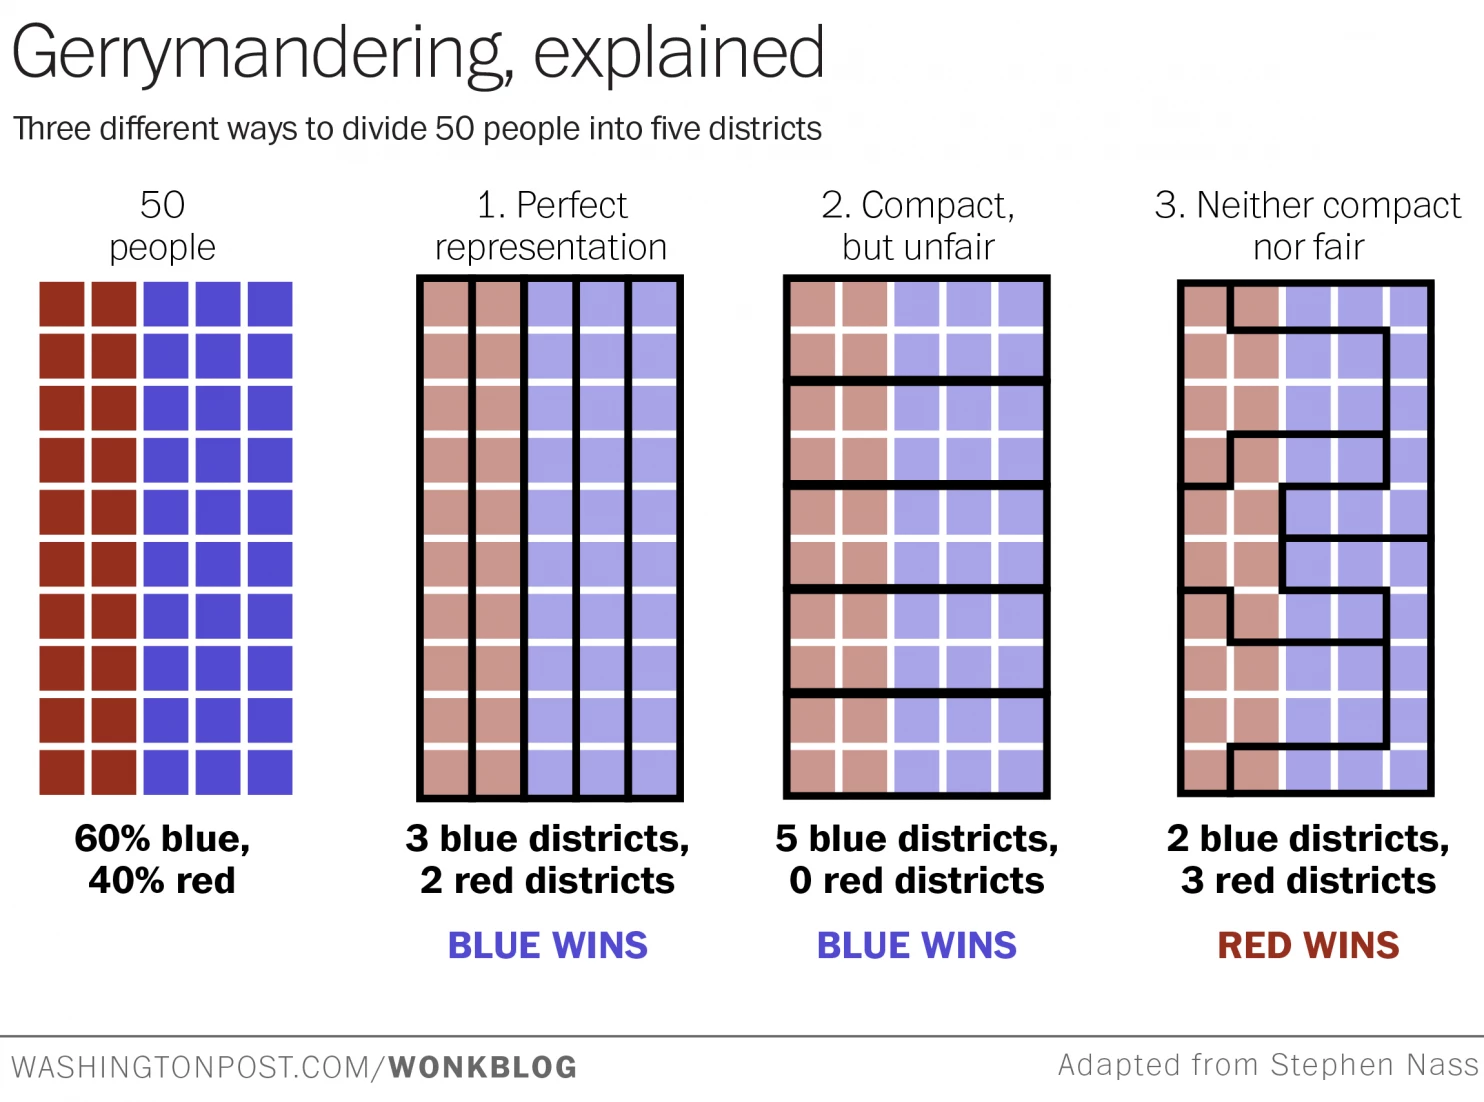
You may have seen this image (originally from reddit) and the accompanying article from the Washington Post about what gerrymandering is, and why it is a problem. But the real problems are articles and images that challenge gerrymandering while conflating space and population, ignoring other considerations, and assuming the existence of an easy solution that simply doesn’t reflect reality.
Conflating Space and Population:
As the author blithely explains the hypothetical represented in the images, “And just our luck, they all live in a nice even grid with the Blues on one side of the state and the Reds on the other.” This NEVER happens in real life. Neither the overall population nor the political parties line up in a nice, even grid over an area large enough to hold an election. Drawing voting lines begins with a reality that it incredibly complicated, in which there is no one clear “perfect representation” as in the images.
To get a sense of this, consider the process of redistricting in Arizona. Start with the population density of the state here and voting age population density here. See anywhere for a nice, neat grid of “perfect representation”? Neither do I. Then browse the set of “What If?” maps created for the commission. Those all represent attempts to combine not only partisan representation and compactness, but a host of other concerns. Even if those were the only two concerns, no map of Arizona districts would reflect any of the images from the WaPo article – actual people just aren’t arranged like pieces on a checkerboard.
Other Considerations:
In Arizona, the redistricting commission was legally bound to consider six criteria:
- Equal population;
- Compactness and contiguousness;
- Compliance with the U.S. Constitution and the Voting Rights Act [including the representation of minority communities];
- Respect for communities of interest;
- Incorporation of visible geographic features, including city, town and county boundaries, as well as undivided census tracts; and
- Creation of competitive districts where there is no significant detriment to other goals.
Population, partisan affiliation, and compactness simply aren’t the only significant factors in drawing district lines.
Consider, for example, a city in which there are two separate but relatively compact communities of African American voters. Their combined population is large enough to create a single district that would most likely elect a representative who was a black Democrat. Divided, they could each form parts of districts in which Democrats maintained an edge but where African Americans were a minority. Is the fact that their preferred party is likely to win sufficient? Or, would it be better for them to be able to elect someone who both represents their partisan interests and reflects their racial identity? If you decide on the latter, of course, that may dilute Democratic votes in the state overall by concentrating these Democratic voters into a single district. The resulting district might look much like PA-7, highlighted in the WaPo article.
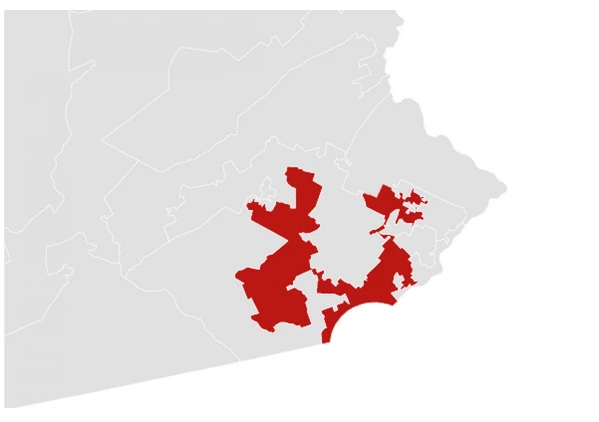 By itself, this image is actually only disturbing if you conflate space with population. Otherwise, there’s nothing inherently wrong with boundaries for a district reflecting the complicated terrain in which actual voters live.
The Best Option:
If by “gerrymandering” we only mean “boundaries that look weird in two-dimensions without any consideration for what people actually live in which areas,” then, yes, there is lots of gerrymandering going on. But when we realize that reality necessitates funky-looking boundaries, most of the problem disappears. Like the old quip about democracy, “gerrymandering” is the worst form of boundary-drawing, except all the others.
The end of the WaPo article captures this nicely, if unknowingly. It’s prescription: computer-drawn boundaries. Of course, as the Arizona examples show, those would still look plenty odd to the untrained eye. And they could only be as good as the instructions we give them. Do you think we’re ready to agree on the priority and relative weight of the six criteria for Arizona’s boundaries? The redistricting commission’s attempts to do so are still being litigated, now before the Supreme Court.
But the real kicker is the “Update” appended at the bottom. It seems that an early version of the story “used California as an example of a majority party giving itself a bigger majority through redistricting.” But, “California’s districts are drawn by an independent commission, not by the parties.” It’s hard to think of a bigger clue that partisan gerrymandering isn’t actually the problem it’s purported to be than the fact that California’s outcome came despite the independence of the commission.
Will some majority parties try to game the system? Sure. But it’s (a) difficult, (b) not that reliable. The fact of the matter is, we’re sorting ourselves well enough that the parties don’t need to resort to complex formulas to divide us further.
Latest posts by Jason LaBau (see all)
- Take Down the Confederate Monuments - August 14, 2017
- The Democratic Split - August 10, 2015
- On Lincoln and Our Second Founding - July 6, 2015